Designing a Minimal-Friction Informatics App to Identify and Reflect on Root Causes of Burnout
Wilson Chen, Saideep Narendrula, and Wonho Lim. Proposal revision, October 2022. The study ran, with me as study lead; its results are not in my archive.
Additional Keywords and Phrases: Reflection in action, Reflection on action, burnout, personal health informatics, friction, visualization
1. Introduction
Finding exhausted and depressed people at companies, schools, streets, and everywhere in the city is easy nowadays. Work-life balance is now regarded as an essential factor that impacts both one’s mental and physical health. However, most people are failing to properly balance them due to personal, economic, and other sociolegal reasons. One of the consequences due to that failure is burnout. Burnout is generally known as a psychological syndrome caused by getting overwhelmed and continuing stress from doing work. People who are burned out tend to be extremely exhausted, depressed, and anxious as they are so stressed about doing any kind of work. In other words, they are not willing to work diligently anymore. Gallup’s survey has shown that 76% of the people responded that they experience burnout at least sometimes during work while 21% of the entire group even mentioned that they experience burnout very often. [1] This result with notable numbers clearly shows that burnout is not a small issue anymore and it is causing a problem right now. Burnout can have a massive impact not only on one’s productivity but also on the development of the entire society if more and more people are burned out. Since the number of people experiencing burnout has been increasing continuously, there should be some action to prevent burnout for the entire society. To solve this problem, it is important to figure out the features and patterns of burnout as well as effective methods to prevent and cure burnout.
1.1 Impact of Burnout on Personal Level
Being burned out, one can experience a drastic downfall in various aspects of one’s life. Most of the people who are experiencing burnout are typically depressed, exhausted, and discouraged. Those negative feelings or emotions are, either directly or indirectly, related to one’s productivity. Burnout ultimately causes mental illness, and that makes one lose not only the ability to finish the work but also the ability to ensure its quality. [2] What “productivity” means, in this case, is not only limited to work or study in general but also includes health preservation, socializing, and other various aspects of life. Failure to maintain work productivity after experiencing burnout pushes one to complete extra work, which can result in a cycle of stress. Socio-organizational activities, which require complex psychological and sociological practice, also make one stressed or depressed. Thus, burnout not only distracts oneself from achieving goals or finishing notable tasks but also discourages one from maintaining mental, physical, and social health. Considering these facts, it is certain that preventing burnout is important for promoting the well-being of individuals.
1.2 Impact of Burnout on Social Level
Even if the burnout of one person does not have a massive impact on society in most cases, it will be different if the total number of people experiencing burnout increases rapidly. Possibly, the entire society could be depressed and discouraged due to burnout. Regardless of importance and area, each person in society has their own unique role. If all software engineers in the world decided not to work due to burnout, so many products and services in various industries would not function properly. If all college students decided not to study for the same reason, all educational institutions and educators would be affected. Decreased productivity of one industry will not only cause discomfort in our daily lives but also discourage other industries. Thus, if a notable number of people experience burnout and lose productivity, the overall productivity of the entire society will be decreased. Various components of society, including economics, culture, politics, and science, will not develop steadily anymore. That situation will not only distract human beings from ultimately developing themselves but also undermine the benefits of maintaining society. Therefore, even at the social level, preventing and managing burnout is an important issue.
3 Preliminary System Design
To inform the design of our system, we set out to articulate clear design goals. First, our system needs to support reflection-in-action, defined as contemplation while performing an activity [9]. In conjunction, our system needs to support reflection-on-action, defined as later contemplation after an activity concludes [9]. Furthermore, the system must minimize friction and maximize intuitiveness. Lastly, the system should nudge users toward actionable insights on healthier behaviors to prevent burnout.
There is a challenge in defining what data should be collected, which is exacerbated by the multifactorial nature of burnout. No one single factor can wholly explain why an individual experiences chronic exhaustion; rather, it is the case that an intersection of multiple variables all contribute toward a holistic understanding of burnout.
3.1 User Stories
We developed a series of preliminary user stories and a map of a user scenario to better understand our problem space and identify areas we could make an impact on (see Figure 1).
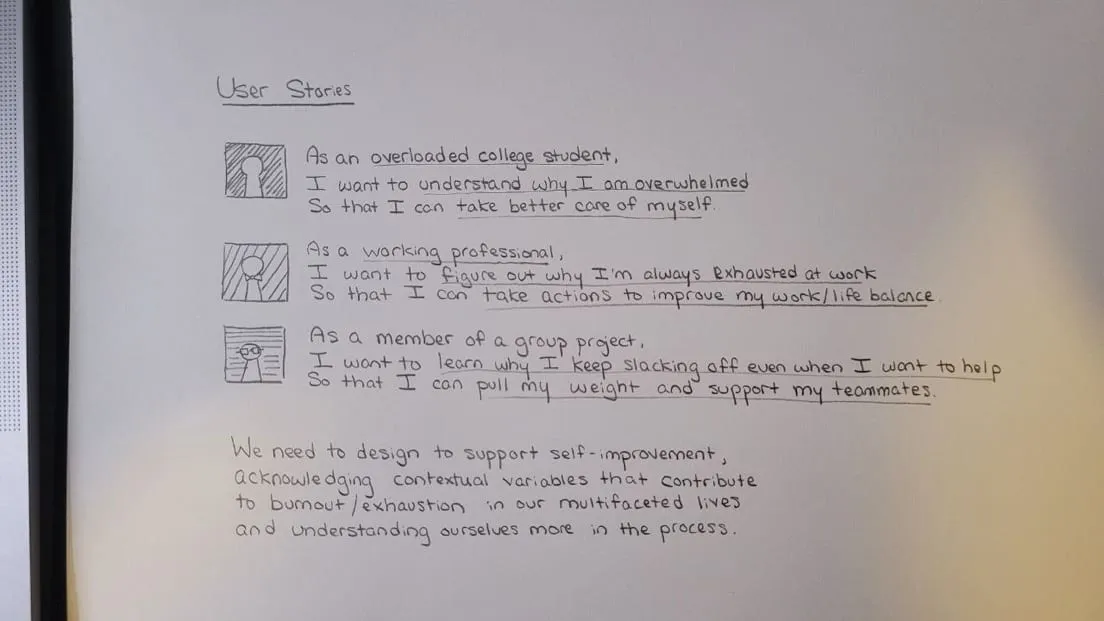
A pattern of behavior became evident for each of the scenarios outlined in Figure 1. Each user desires a specific outcome, but the existence of burnout creates significant friction between their current state and their desired state.
3.2 Identifying Tracking Dimensions
We examined an example of a user behavior we sought to correct via the guidance of our system (see Figure 2). This scenario is modelled off of our own experiences with burnout. In the beginning, the user is stressed out by how much work they need to accomplish. Due to the stress, they are too exhausted to complete the work. Due to the exhaustion, the user distracts themselves with self-destructive behaviors like browsing social media. Due to the distraction, the user fails to complete their work on time. This sequence is a causal chain. In order to effectively address user needs, it is imperative to consider interventions at each stage: “how can we change this?”. The analysis arrived at five trackable dimensions of burnout management from this scenario, which we identify as time management, nutrition, sleep, exercise, and digital use tracking. These tracking dimensions neatly map to the existing literature on strategies for preventing burnout [11], giving us confidence in the validity of these metrics.
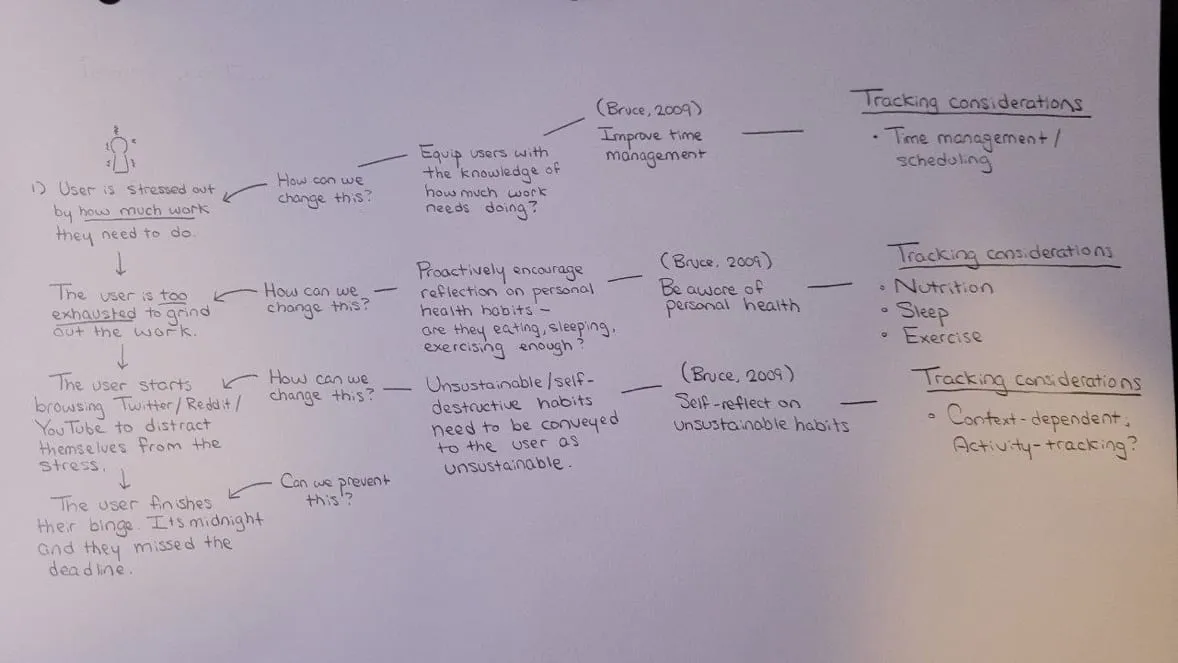
A significant caveat to these identified dimensions is that tracking multivariate data quickly becomes cumbersome. While a fully automated tracking approach relieves capture burden and supports long-term tracking [10], this is not feasible across dimensions like nutrition, where calories, macronutrients, and micronutrients need to either be manually inputted or retrieved from an existing database (with varying degrees of nutritional accuracy). Furthermore, automated systems lack the awareness and engagement afforded by manual tracking [10], where users have the conscientiousness to reflect on their data while they are inputting it. We place high priority on reflection during data input as a method of supporting reflection-in-action, while recognizing that expecting burned-out users to input large amounts of manual data is not feasible. This study aims to design an informatics reporting system that reconciles these competing interests.
3.3 System
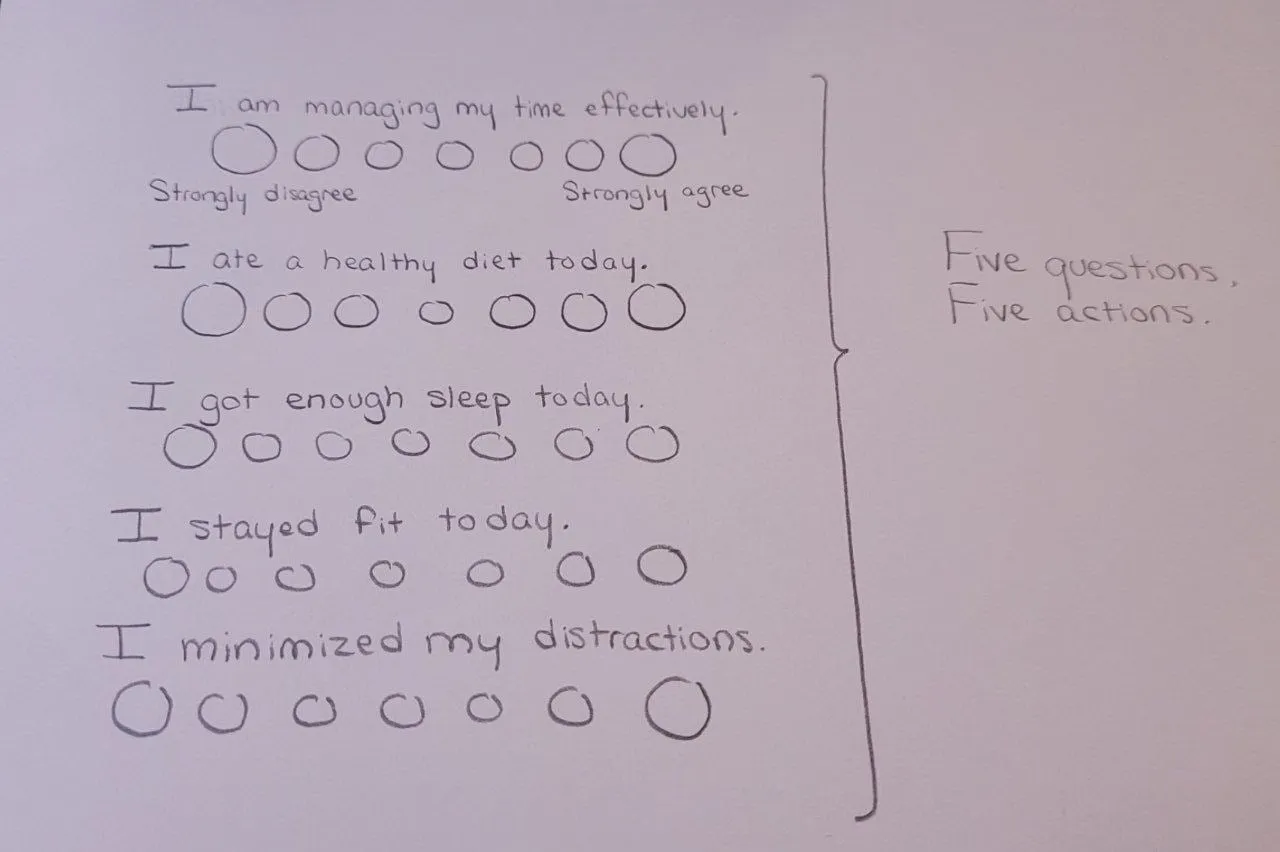
We propose the design of a data input system utilizing single-item 7-point Likert scales to approximate the measure of burnout dimensions. As discussed in Related Work, a single-item measure for burnout served as a reliable substitute for a full-scale questionnaire [7]. We hypothesize that using self-report single-item measures for each dimension of burnout may be an effective method of maximizing the benefits of manual tracking while minimizing the negatives. Our low-fidelity mockup of this system is shown below in Figure 3.
We call this a “snapshot” approach to self-reporting. This approach has several advantages. For one, the time taken to report data is drastically reduced. Five questions are asked, one per dimension of burnout. For each, the user rates their perception of agreement with the question on a 7-point Likert scale. Next, the user only needs to make five inputs in order to complete data entry, minimizing the burden associated with traditional means of manual data input. Furthermore, the question design is flexible, allowing users to assess their agreement according to their own relative needs. What constitutes agreement toward “I ate a healthy diet today” is different for a person trying to gain weight versus a person trying to lose weight, and this line of questioning makes no prior assumptions. This design supports reflection-in-action by deliberately asking the user to reflect on their agreement with each statement. We anticipate that as users enter data, they will evaluate their response against where they ought to be.
In addition to the “snapshot” approach, we also consider asking the user to write down a quick justification for why they selected their response if their answer fell within the “disagree” side of the scale. We anticipate that this will bolster the benefits of reflection-in-action by promoting more thoughtful understanding of their habits – “I rated myself ‘strongly disagree’ on minimizing distractions today because I kept multitasking and checking Twitter”. Through this response-justification pattern, users should gain a more conscientious understanding of why they fall short of meeting their desired burnout prevention outcomes.
We note that during our initial pitch, a critique was raised about why we chose not to ask for justifications about responses on the “agree” side of the scale. We agree that this is likely an important consideration. Our user stories had primarily focused on the subset of users who were already experiencing burnout, so our components were designed for this primary user. A secondary user may be a person who is not experiencing burnout but wishes to remain at a stable level of mental wellbeing. A user who is already burnt out feels more burdened by entering justifications for every dimension. On the other hand, they may identify patterns about days where they experienced high ratings, which could provide reinforcement of the desired outcome.
3.3.1 Dashboard Visualization
The purpose of visualization is to produce insight. The second piece to our system supports reflection-on-action by displaying the integrated snapshots over time in an interactive dashboard interface. The design philosophy for this interface design follows Shneiderman’s information visualization mantra: overview first, zoom and filter, then details on demand [12]. We aim to minimize information overload associated with some dashboard systems, and support user interactivity to allow data exploration. We aim to solidify our visualization approach in greater detail by the date of the proposal revision.
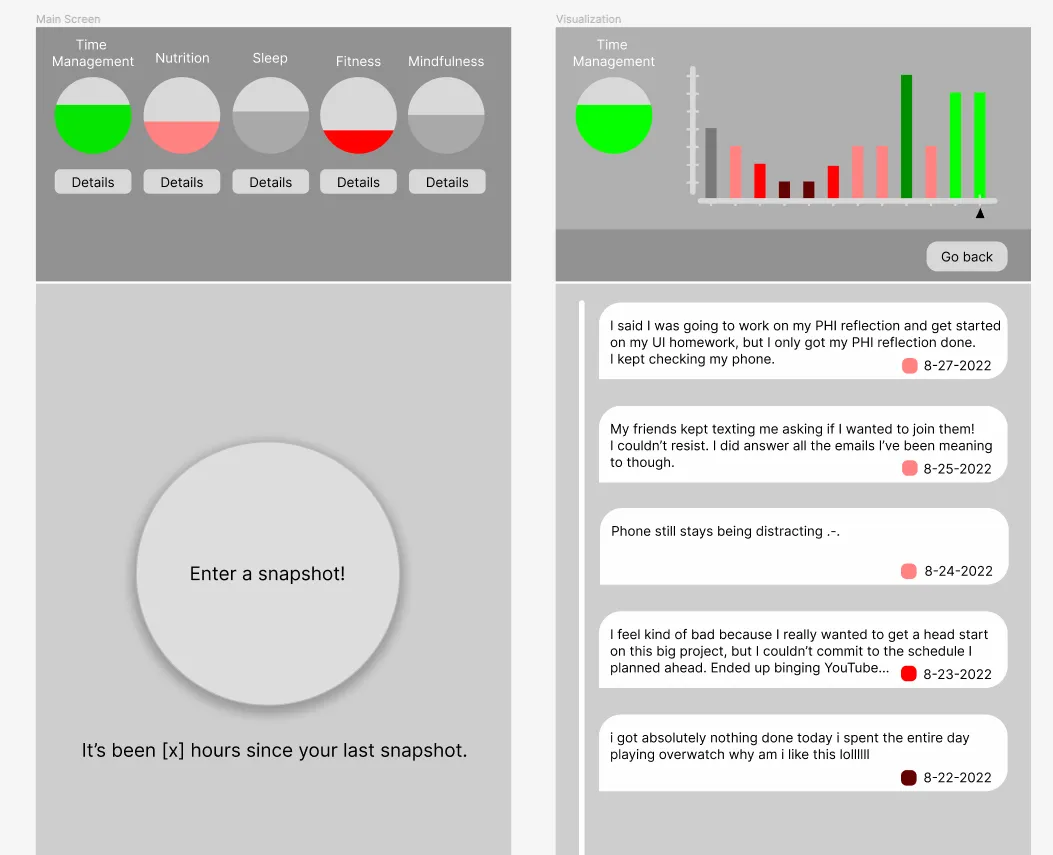
What would this look like? Our Likert-scale data can be evaluated as a 1-through-7 interval scale measurement. Each dimension can be mapped to a red-green color encoding. We will redundantly encode using position on a common scale to reinforce the visualization. Tapping the icon for any given dimension will allow you to see its trends over time through a time series visualization on the top third of the screen, supporting zoom/filter. On the bottom two thirds of the screen will be a view of journal logs from days where satisfaction with that dimension was reported as negative, in time-descending order. These details support reflection-on-action and help users identify patterns for the days they reported a dimension as negative. Figure 4 shows a very low fidelity prototype of what this system may feel like.
4 Evaluation
4.1 Pilot Study
We plan to conduct a pilot study which will recruit a few of our immediate contacts, and use a basic Google Forms implementation of the “snapshot” system to catalog burnout self-report data over a period of two weeks. We anticipate that each of us will recruit at least 1 of our contacts for the pilot (total n = ~3), utilizing convenience sampling given the constraints of this class project. We will use this data as the input data for the metrics of our reflection-on-action dashboard visualization. We intend to complete these components by the date of the second progress report. These participants will be anonymized, and logs will be reviewed for any personally identifiable information in order to ensure confidentiality of potentially sensitive information.
4.2 Recruitment Plan
Once our high-fidelity Figma prototype and our dashboard visualization system are implemented, we will begin to administer usability tests. We intend to bring back the contacts we collected data from during our pilot study to gather their thoughts on the system. Additionally, we will attempt to recruit a few participants who were not present during the pilot in order to gain their perspective on the system as well. We will ideally aim to gather at least six participants, or two per project member (total n = ~6).
4.3 Evaluation Plan
Participants will first be given a questionnaire about their existing productivity habits. Alongside, they will be administered the Burnout Assessment Tool (BAT) [13] to measure baseline burnout scores. Next, they will be introduced to the system. Participants will input a snapshot and explore the visualization; they are encouraged to verbalize their thought process as they navigate through each step. Researchers will observe user actions and take notes accordingly. Afterward, the user responds to a post-study questionnaire and is asked to participate in a semi-structured interview. Questions include “What did you enjoy about this system?”, “What did you not enjoy?”, and “Is this something you can see yourself using?”. Finally, we will synthesize the data from the study to draw insights, discuss findings, and iterate on our design.
4.4 Measures and Ecological Validity
This study provides validation for our research question by using a mixed-methods approach to understand how users interact with our system. In a full study with a developed system, we would aim to capture app retention rates, upward trends in the snapshots over time, and user satisfaction. However, this is not feasible over the course of one semester. Instead, to measure the effectiveness of our prototype, we will seek to measure the frequency of insight generation as the user interacts with the app. In particular, we want to see the user reflect on behaviors and verbalize those thoughts during the snapshot stage (reflection-in-action) and the visualization stage (reflection-on-action). Furthermore, we will code patterns in the sentiment towards the system to substitute for user satisfaction and retention. Finally, for the participants who were present during the pilot study, we will use descriptive statistics to determine whether a statistically significant change in behavior occurred for each user during the two weeks.
4.5 Timeline
Between now and the rest of the semester, we have a total of nine weeks to administer our project. Our timeline for the completion of this project is as follows.
- Week 1 (10/10) – Brainstorm visualization design and revise our proposal.
- Week 2 (10/17) – Begin our two-week-long paper logging pilot study. Start developing a high-fidelity prototype. Progress Report 1 is due this week.
- Week 3 (10/24) – Continue our two-week-long paper logging pilot study. Continue developing our high-fidelity prototype.
- Week 4 (10/31) – Finish developing the high-fidelity prototype. Integrate the data from our pilot study into the prototype. Progress Report 2 is due this week. Our system should be ready for evaluation.
- Week 5 (11/7) – Recruit participants for usability tests. Begin conducting usability tests.
- Week 6 (11/14) – Finish recruiting participants. Finish conducting usability tests.
- Week 7 (11/21) – Begin synthesizing data. Work on transcribing interviews. Begin developing final paper.
- Week 8 (11/28) – Finish synthesizing data. Use descriptive statistics to understand if our two-week pilot induced statistically significant behavior change. Use thematic analysis to code emerging patterns from interviews. Continue developing final paper, and create final presentation.
- Week 9 (12/5) – Finish developing the final paper.
References
- [1] Wigert, B. (2022, September 28). Employee burnout: The biggest myth. Gallup.com. Retrieved October 12, 2022, from https://www.gallup.com/workplace/288539/employee-burnout-biggest-myth.aspx
- [2] Bullock, G., Kraft, L., Amsden, K., Gore, W., Prengle, B., Wimsatt, J., Ledbetter, L., Covington, K., & Goode, A. (2017, June 30). The prevalence and effect of burnout on Graduate Healthcare Students. Canadian medical education journal. Retrieved October 12, 2022, from https://www.ncbi.nlm.nih.gov/pmc/articles/PMC5661741/
- [3] Maslach, C., Jackson, S.E., Leiter, M.P. (1986). Maslach Burnout Inventory Third Edition: Mind Garden. Retrieved September 30, 2022, from https://www.researchgate.net/profile/Christina-Maslach/publication/277816643_The_Maslach_Burnout_Inventory_Manual/links/5574dbd708aeb6d8c01946d7/The-Maslach-Burnout-Inventory-Manual.pdf
- [4] Koeske, G. F., & Koeske, R. D. (1989). Construct validity of the Maslach Burnout Inventory: A critical review and reconceptualization. The Journal of Applied Behavioral Science, 25(2), 131-144.
- [5] Demerouti, E., & Bakker, A. B. (2008). The Oldenburg Burnout Inventory: A good alternative to measure burnout and engagement. Handbook of stress and burnout in health care, 65(7).
- [6] Trockel, M., Bohman, B., Lesure, E., Hamidi, M. S., Welle, D., Roberts, L., & Shanafelt, T. (2017, December 1). A brief instrument to assess both burnout and professional fulfillment in physicians: Reliability and validity, including correlation with self-reported medical errors, in a sample of resident and practicing physicians - academic psychiatry. SpringerLink. Retrieved October 12, 2022, from https://link.springer.com/article/10.1007/s40596-017-0849-3
- [7] Dolan, E. D., Mohr, D., Lempa, M., Joos, S., Fihn, S. D., Nelson, K. M., & Helfrich, C. D. (2015). Using a single item to measure burnout in primary care staff: a psychometric evaluation. Journal of general internal medicine, 30(5), 582-587.
- [8] Dyrbye, L. N., Satele, D., Sloan, J., & Shanafelt, T. D. (2013, March). Utility of a brief screening tool to identify physicians in distress. Journal of general internal medicine. Retrieved October 12, 2022, from https://www.ncbi.nlm.nih.gov/pmc/articles/PMC3579983/
- [9] Ploderer, B., Reitberger, W., Oinas-Kukkonen, H., & van Gemert-Pijnen, J. (2014). Social interaction and reflection for behaviour change. Personal and ubiquitous computing, 18(7), 1667-1676.
- [10] Choe, E. K., Abdullah, S., Rabbi, M., Thomaz, E., Epstein, D. A., Cordeiro, F., ... & Kientz, J. A. (2017). Semi-automated tracking: a balanced approach for self-monitoring applications. IEEE Pervasive Computing, 16(1), 74-84.
- [11] Bruce, S. P. (2009). Recognizing stress and avoiding burnout. Currents in pharmacy Teaching and Learning, 1(1), 57-64.
- [12] Shneiderman, B. (2003). The eyes have it: A task by data type taxonomy for information visualizations. In The craft of information visualization (pp. 364-371). Morgan Kaufmann.
- [13] Schaufeli, W. B., Desart, S., & De Witte, H. (2020). Burnout Assessment Tool (BAT)—development, validity, and reliability. International journal of environmental research and public health, 17(24), 9495.